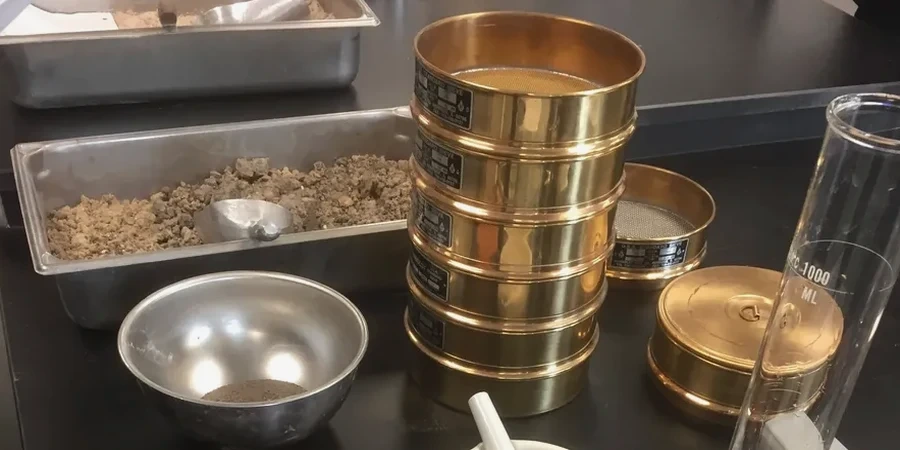
Overlooking the fines content in a glacial till can delay a St. John's foundation pour by weeks. Many contractors assume a visual classification is enough, but the silty matrix common across the Avalon Peninsula behaves very differently under freeze-thaw cycles than a clean sand. Our laboratory runs the full grain size analysis—sieve plus hydrometer—to quantify exactly that silt and clay fraction. The combined curve from 75 mm down to 0.001 mm reveals the soil's real drainage potential and frost susceptibility, parameters directly tied to the NBCC requirements for footing depth. When a site on Kenmount Road hits a pocket of marine clay, knowing the particle-size distribution before ordering concrete saves rework. We often pair this with Atterberg limits to confirm plasticity, and with test pits to correlate lab data with field stratigraphy.
A soil with 12% fines and a uniformity coefficient below 3 will pump water under traffic load—the grain size curve tells that story before the first truck arrives.